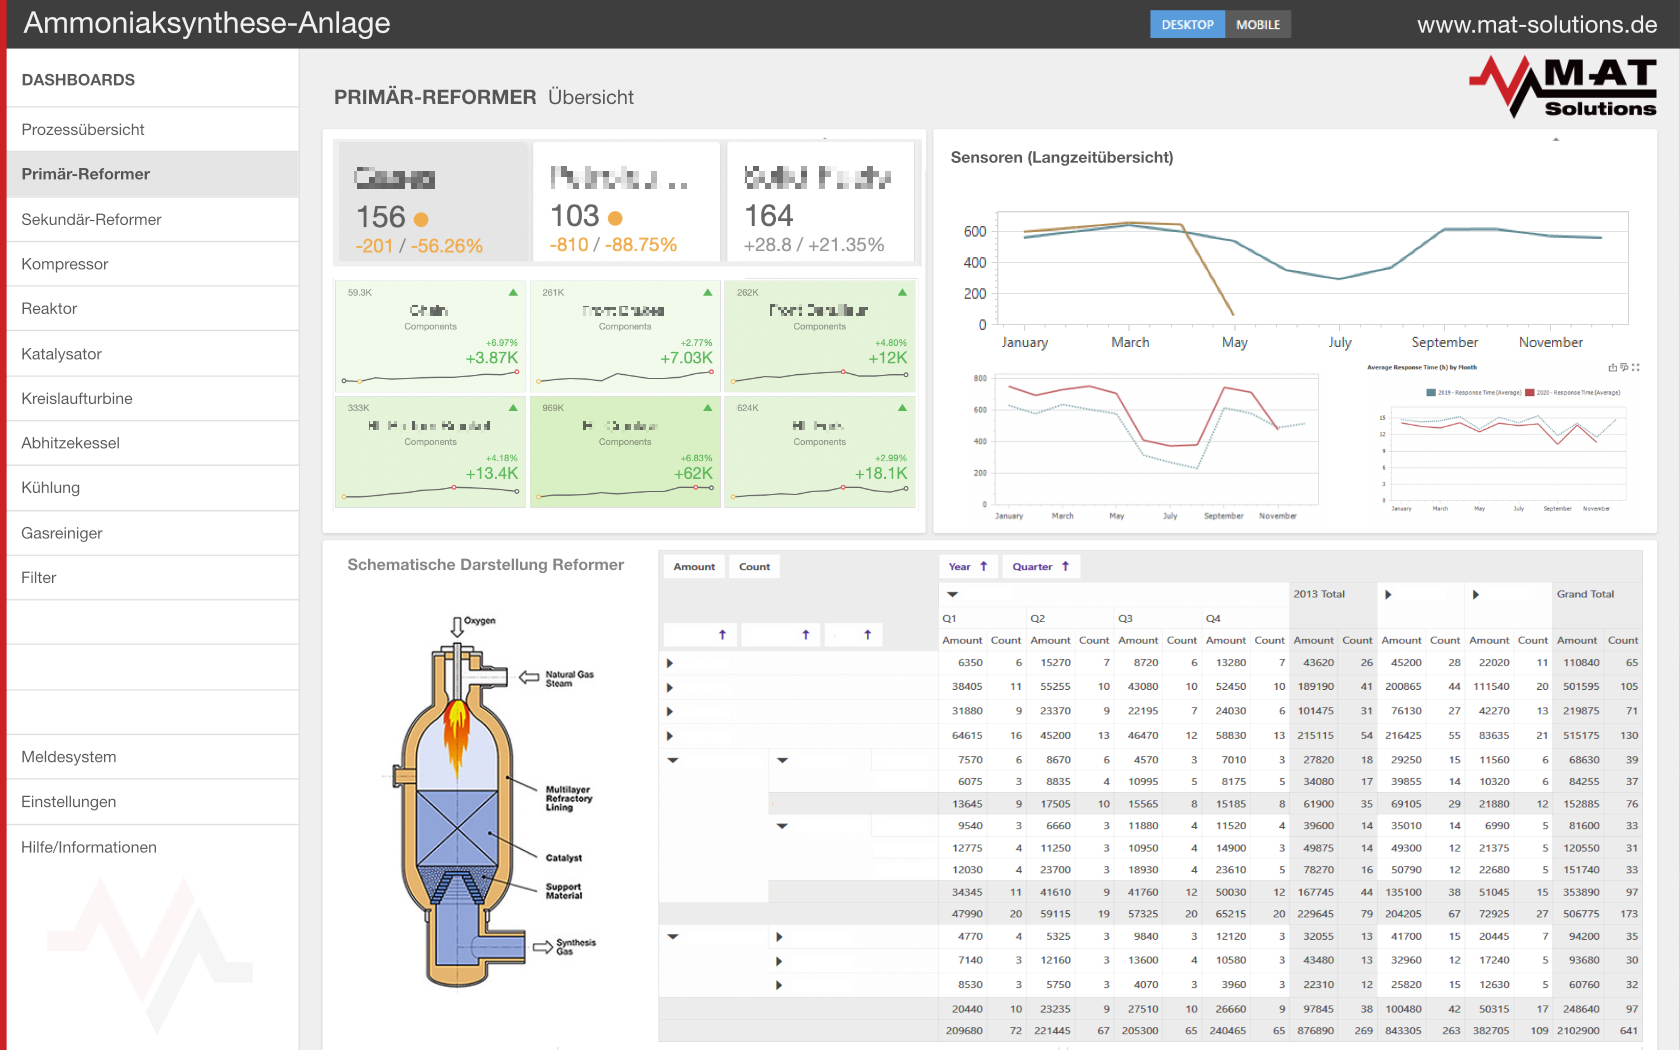
Dashboard for process and data visualization in the areas of Industry 4.0, Risk-Based Inspection, Predictive Maintenance, Asset Integrity Management
As the interface between the product and the user, a dashboard not only serves to prepare and display data, but it is the key to the process and to the data.
With a high level of functionality, simple and clear usability and the best possible flexibility, the dashboard enables the maximum benefit to be generated from the available data.
Basic Version
In the customer-specific basic version of our dashboard, information, status displays, trends and progressions can be visualized. The dashboard is adapted to the use case of the project and provides exactly the information that is required and desired in this context.
Different display formats are supported (e.g. display fields, diagrams, trend curves, diagrams with tolerance band display, pie charts, bar charts, graphic import of provided schemes and diagrams from the control center, etc.).
The arrangement and the forms of presentation used for the respective data set are coordinated and determined within the scope of the project, and the data is linked to the respective data sources via a fixed connection.
Adaptations and extensions are possible at any time together with our developers.

Flex Version
The Flex version of the dashboard is based on our modular framework and includes configurable user management. The Flex dashboard framework enables the creation and editing of dashboard interfaces.
Different dynamic display components and display formats are available for this purpose. Trained users (dashboard administrators) can create dashboards themselves, link various data sources and adapt the interface to the end user's specific needs - without requiring any software customization. For the integration of mathematical and statistical functions, the Flex dashboard offers a plug-in interface, which enables the easy integration of new functions and services.
Plugins can of course be developed and provided on customer request, suitable for the respective use case.

Highlights
- Modern dashboard as native application and/or web application
- Dynamic visualization components and display formats
- Free connection of visual components to various data interfaces
- Consistent overview of all available key figures
- Modular framework with plugin interface and user management
- Visualization and connected data sources configurable (self-service possible)
- Real-time access to all data (optionally worldwide via cloud)
On-Premises or in the cloud?
Our dashboards can be run locally, directly on the server (on-premises).
Alternatively, we also provide our dashboards as a cloud solution at the well-known service providers Amazon Web Services (AWS), Microsoft Azure or Google Cloud, thus enabling worldwide access to the data.


